


On this page
CTV performance metrics, also called CTV ad performance metrics or CTV KPIs, show what a connected TV campaign delivered and what it produced. They fall into four groups, in the order a campaign runs: delivery, response, outcomes, and incrementality.
Every CTV report needs its definitions written next to the numbers, because "there is no standardized definition of a view or an impression," as CIMM's July 2025 CTV guide notes, and impression counts vary by "time, sound, viewability" from one streaming service to the next.
Which CTV metrics marketers use
In a February 2026 survey of 2,020 marketing and advertising decision makers in 25 countries, published in DoubleVerify's 2026 Global Insights report, marketers who advertise on streaming TV platforms named the measures they use. Among them:
- Cost efficiency: 40%.
- Reach and frequency: 39%.
- ROAS: 36%.
- Incremental reach against linear TV: 27%.
Brand awareness or brand lift, conversions, and completion rate were each named by about a third. Pick one metric from each of the four groups below before launch, and write its target next to it.
Delivery metrics
CTV impressions
The point at which an impression is counted changes what it means. IAB's Anatomy of a Video Impression, published in December 2024, says an ad "must be loaded and, at minimum, begin to render (including ensuring the video has begun to play) to be counted as a valid impression." When ads are stitched into the stream on a server, IAB Tech Lab's VAST 4.3 allows that "an impression could be reported as the ad is sent on the stitched stream."
- Formula: a count of ad exposures, not deduplicated.
- Data source: the ad server or the player's tracking calls.
- Reading: ask each platform whether its impressions are counted on the device or on the server, and compare platforms only on the same basis.
Household reach
A household reach figure counts homes, not people. Household-level reach is "The number of unique residential households reached," in IAB's Anatomy of Reach, from October 2025, and it "does not distinguish how many individuals in the household were exposed." IAB also asks that "Reach measurement should be clearly labeled to indicate whether it reflects households, devices, or individuals."
- Formula: unique households exposed at least once, or that count divided by the target universe for reach as a percentage.
- Data source: device IDs, IP addresses, app IDs, or logins resolved to households.
- Reading: a device count can be larger than a household count, since one household can have several devices. CIMM warns that "reliably resolving IP addresses to households can be challenging," so ask which identity method sits behind the number before comparing platforms.
Frequency
How often the average reached household saw the ad follows from the two metrics above. IAB gives the formula directly: "average frequency is derived from: Total Impressions ÷ Reach."
- Formula: impressions ÷ households reached.
- Data source: the same impression log and reach count, deduplicated by one identity method.
- Reading: an average of 4 can hide households at 1 and households at 15. Ask for the distribution by exposure band, and check the share of households above the cap set at launch.
CTV completion rate
Completion rate checks that delivered ads played through. Google's Display & Video 360 metrics list defines it as "The percentage of video impressions that played to completion." In VAST, the signal is the complete event, which IAB Tech Lab defines as "The creative was played to the end at normal speed so that 100% of the creative was played."
- Formula: completed views ÷ video impressions × 100.
- Data source: the player's complete event, reported by the ad server or a verification partner.
- Reading: DoubleVerify's 2026 report puts CTV video completion rate at 97% in the United States, from its tag-based open web data for 2025. With the US average at that level, treat completion rate as a delivery check on each line item, not a ranking metric.
CPM and cost per completed view (CPCV)
Both metrics price delivery, CPM per thousand impressions and CPCV per completed view. The Media Rating Council's Outcomes and Data Quality Standards define CPM as the "Cost to generate 1,000 exposures, most commonly - Impressions."
- Formula: CPM = media cost ÷ impressions × 1,000. CPCV = media cost ÷ completed views, which equals CPM ÷ 1,000 ÷ completion rate.
- Data source: the buying platform's spend, the ad server's impressions, and completed views from the complete event.
- Reading: at 97% completion, CPCV sits about 3% above the cost of one impression. When CPCV rises while CPM holds flat, completion is falling on that line item. Compare CPMs only on the same impression definition and fee basis; market ranges and fees are in Starti's guide to CTV advertising cost.
Response metrics
Site visits
This metric counts website traffic matched to exposed households, and "digital property traffic such as to a site or application" is a measure of outcomes under the MRC standard.
- Formula: visit rate = matched visits ÷ households reached. Cost per visit = spend ÷ matched visits.
- Data source: a site pixel or server-side events, matched to exposed households within a set window.
- Reading: a matched visit followed exposure, which does not prove the ad caused it. Read visit rate by app and creative to move budget, and leave cause to the incrementality group.
QR code scans
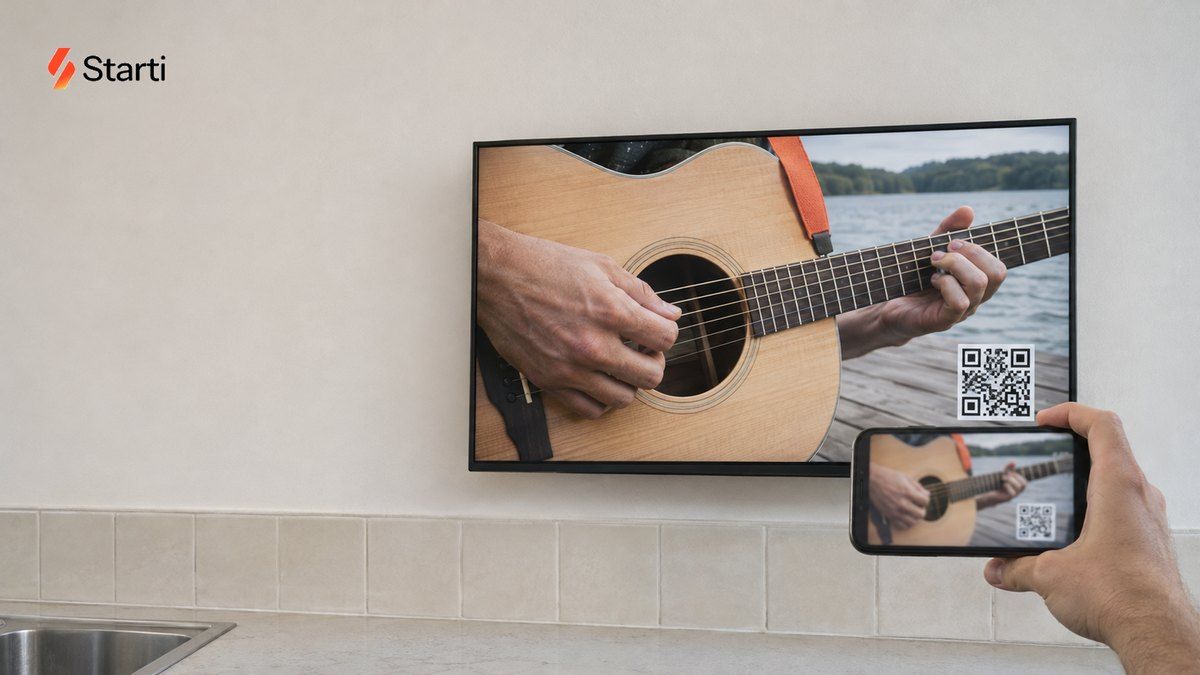
A scan gives CTV a click to count: Adjust, a mobile measurement partner, records a scan "as a click" on the tracking link behind the code, and "QR Scans" sit among positive interactions with an ad in the MRC standard.
- Formula: scan rate = scans ÷ impressions.
- Data source: a unique tracking link encoded in each QR code, read by the site analytics or the mobile measurement partner.
- Reading: scans miss viewers who type the URL or search for the brand later. Give each creative its own link, so the scan rate compares creatives as well as placements.
App installs
Installs from CTV are matched, not observed, and the match runs on the household's IP address. AppsFlyer uses "View-through attribution using probabilistic modeling (IP address)," and Singular relies on "devices in the same household commonly using the same IP address."
- Formula: installs attributed to CTV within the window. Cost per install = spend ÷ attributed installs.
- Data source: the mobile measurement partner.
- Reading: the partners count differently, so compare installs only under the same partner and settings. AppsFlyer allows "multiple installs within the same household" to be attributed to one CTV impression, while Singular states that "Each CTV ad impression can only result in one attributed install or re-engagement." Set windows as in CTV ad measurement.
Outcome metrics
Cost per acquisition (CPA)
CPA is calculated from other numbers: the MRC standard lists "Cost per Action (CPA)" among efficiency metrics that "can be mathematically derived from cost and/or exposure measures."
- Formula: spend ÷ attributed conversions.
- Data source: conversion events from a pixel, a conversion API, or a mobile measurement partner, and spend from the buying platform.
- Reading: report view-through and click-through conversions separately. IAB's conversion API guide notes that "CTV ads are mostly viewed, with little direct interaction." Compare CTV CPA and conversion rate with paid social only under the same attribution window.
CTV ROAS
ROAS sets revenue against spend: under the MRC standard it is an outcome metric where "for every dollar spent, this is the expected return in terms of sales or desired Outcomes."
- Formula: attributed revenue ÷ spend.
- Data source: revenue or conversion value from the advertiser's systems, matched to exposure, and spend from the buying platform.
- Reading: attributed ROAS includes revenue that would have arrived anyway. IAB's guide to conversion APIs for CTV, from October 2025, adds that "ROAS should not be treated as the universal measure of success": a campaign aimed at new customers needs a new-customer metric next to it.
Incrementality metrics
Incremental lift
Lift estimates how much of the result the ad caused. The MRC standard defines incrementality as "the potential causal impact of marketing." The arithmetic comes from Google Ads' Conversion Lift documentation.
- Formula: incremental conversions = treatment conversions − control conversions. Relative lift = incremental conversions ÷ control conversions.
- Data source: incrementality testing through a household holdout or a geo test, read on the same conversion data as the outcome metrics.
- Reading: treatment and control should convert at similar rates in the weeks before the test, and the lift report should give a confidence interval next to the point estimate. Fix the holdout size and the read date before launch, and keep the control out of every other CTV campaign during the test.
Incremental ROAS (iROAS)
The same test prices what the campaign added. Google Ads defines incremental return on ad spend as "Incremental conversion value / Total ad spend," and incremental cost per action as "Total ad spend / Incremental conversions."
- Formula: iROAS = incremental conversion value ÷ spend.
- Data source: the lift test's incremental value and the campaign's spend.
- Reading: iROAS divided by attributed ROAS gives the share of attributed revenue the campaign caused. A campaign with a 0.6 ROAS and a 0.24 iROAS caused 40% of the revenue it was credited with. Scale on iROAS against the target, and use attributed ROAS for weekly moves between apps and creatives.
How to read the four groups together
Check the groups in this order each week, with one action for each:
- Delivery: a line item whose completion rate trails the rest of the campaign, or whose households sit above the frequency cap, gets fixed before its results are read.
- Response: budget moves between apps and creatives on visit rate, scan rate, and attributed installs.
- Outcomes: CPA and ROAS are compared with the targets set at launch, under the same attribution window as other digital channels.
- Incrementality: a budget increase waits for the holdout read.
Example: A filled-in weekly CTV scorecard
An example for a subscription app's first CTV test, with illustrative numbers:
- Targets set before launch: a frequency cap of 6 exposures per household per week, and an incremental CPA of $100.
- Delivery: 1,200,000 impressions, 300,000 households reached, an average frequency of 4.0, 3% of households above the cap, and a 96% completion rate.
- Response: 2,400 QR scans, a 0.2% scan rate, and 9,000 matched site visits.
- Outcomes: 600 attributed trial starts on $30,000 of spend, a $50 CPA, and $18,000 of attributed first-month revenue, a 0.6 ROAS.
- Incrementality: the holdout shows 240 incremental trial starts, an incremental CPA of $125, and $7,200 of incremental revenue, a 0.24 iROAS.
- Read: the campaign caused 40% of the trials credited to it, and its $125 incremental CPA sits above the $100 target. Delivery passes its checks, with 96% completion and 3% of households above the cap, so the next week holds the budget flat and tests a new creative and a second audience.
CTV performance metrics in Starti AI DASH
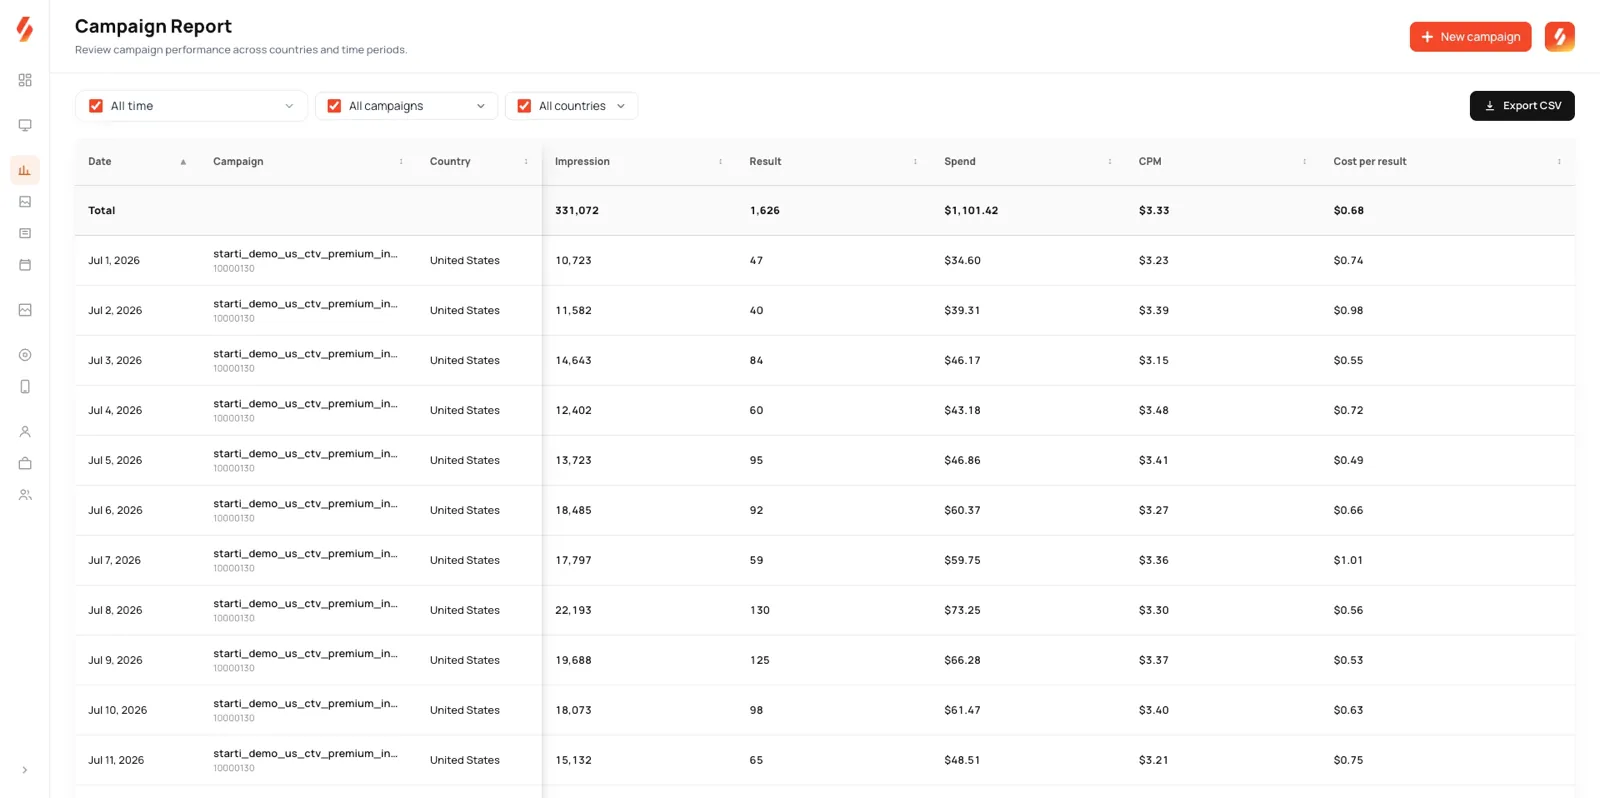
Starti measures each campaign against its own goal, installs, registrations, or revenue, and the results shape the next round of creative and CTV placement. AI DASH brings campaign delivery, creative performance, media quality, and results into one reporting layer, and it connects CTV exposure to supported visits, installs, registrations, purchases, and revenue.
The Adaptive Performance Engine continuously evaluates campaign performance and automatically adjusts bids and budgets across creatives and media. For web goals, Web Solution optimizes delivery around the awareness, traffic, or conversion goal selected for the campaign.
Book a demo to see the metrics AI DASH reports for a first CTV test.
Frequently asked questions
What are CTV performance metrics?
CTV performance metrics measure what a connected TV campaign delivered and produced, in four groups: delivery (impressions, household reach, frequency, completion rate, CPCV, CPM), response (site visits, QR scans, app installs), outcomes (CPA, ROAS), and incrementality (incremental lift, iROAS).
What is a good CTV completion rate?
DoubleVerify's 2026 report puts CTV video completion rate at 97% in the United States, from its open web data for 2025. At that level, completion rate works as a delivery check rather than a ranking metric.
How is CTV ROAS calculated?
CTV ROAS is attributed revenue divided by ad spend. On CTV, the revenue is matched to exposed households through a pixel or a mobile measurement partner within a set window.
What is the difference between ROAS and iROAS?
ROAS uses all revenue attributed to the campaign. iROAS uses only the revenue a holdout or geo test shows the campaign added, divided by spend.